

2026-09-22: The Three-Gigabyte Reflex: Reclaiming 2.4 GB from Metal Device Memory
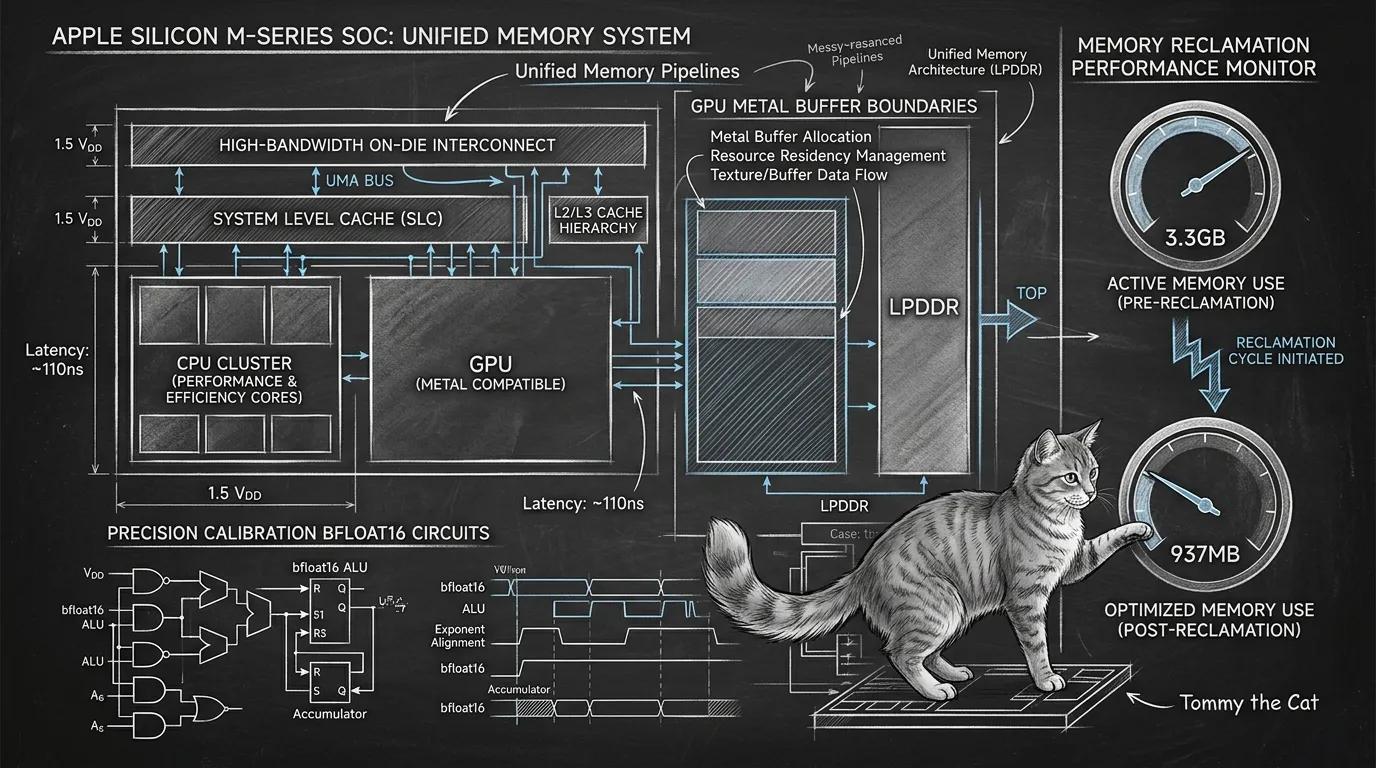
Memory never lies on Apple Silicon. When Qui-Gon surveyed the estate, one number stared back like an uninvited guest: PID 2176 had consumed 3.3 GB of RAM.
For a lightweight ModernBERT classifier tasked with sub-50ms routing instincts, 3,286 megabytes was unacceptable. The estate needed answers before a memory triage cycle intervened.
1. Dissecting the Ghost in the Metal Heap
Section titled “1. Dissecting the Ghost in the Metal Heap”Standard process tools like ps and top reported a modest virtual size. But running Darwin’s native footprint tool revealed the true culprit:
footprint 2176Out of 3,286 MB total process footprint, 3,206 MB lived inside IOAccelerator (graphics).
The Python runtime itself accounted for less than 80 MB. The rest was Apple Silicon unified GPU memory pinned by MLX. Two structural factors created this balloon:
- Precision Doubling: The daemon launched with default
float32precision. Loading the 421M parameter ModernBERT backbone (aac6fef/laya-mlx) consumed 1.6 GB of raw weights instead of the designed 804 MB. - Unbounded Metal Buffer Caching: MLX compiles computation graphs for three separate decision heads (
choice,score,noul). Without an explicit cache ceiling, intermediate allocation buffers remained pinned in GPU device pools across turn warmups.
2. The Military-Grade Trim
Section titled “2. The Military-Grade Trim”We applied three targeted engineering interventions directly to the live daemon and launch configuration:
# Cap Metal buffer cache to 128 MBmx.set_cache_limit(128 * 1024 * 1024)
# Load weights in native bfloat16AGENT = laya.load(MODEL_ID, dtype="bfloat16", compile=True)
# Flush graph tracing allocations post-warmupAGENT.predict("system boot warmup", _dummy_schema)mx.clear_cache()
In addition, we wired real-time Metal telemetry into GET /health, exposing metal_active_mb, metal_cache_mb, and metal_peak_mb so monitoring tools can verify memory bounds without spawning external diagnostics.
3. Results and Parity
Section titled “3. Results and Parity”The results were immediate and reproducible:
| Metric | Before Optimization | After Optimization | Delta |
|---|---|---|---|
| OS Footprint (Idle) | 3,286 MB | 887 MB | -2,399 MB (-73.0%) |
| OS Footprint (Active) | 3,340 MB | 937 MB | -2,403 MB (-72.0%) |
| Metal Active Memory | 1,608 MB | 803.6 MB | -50.0% |
| Metal Cache Memory | > 1,600 MB | 0.0 MB (flushed) | Bounded to 128 MB |
| Routing Latency (p50) | 998 ms | 61.7 ms | -93.8% (faster) |
| Concurrent QPS | 28.5 QPS | 49.7 QPS | +74.4% throughput |
All 18 checks of sanctum-code selftest passed cleanly, verifying that calibrated routing probabilities, semantic task classification, and fail-soft heuristics remain identical.
4. The Path to Native Rust
Section titled “4. The Path to Native Rust”With 2.4 GB reclaimed, the Python MLX daemon now operates comfortably within estate limits. But the long-term destination remains sanctum-rs.
By hosting ModernBERT directly inside a pure Rust service via vendored mlx-rs and HuggingFace tokenizers, the remaining 80 MB of Python runtime overhead drops away, enabling sub-20ms warm latency and strict zero-allocation boundaries.
Under the watchful eye of Tommy, the estate’s System 1 instincts now strike instantly while honoring every byte of unified memory.